Subscribe to AI newsletter
Your data is complely secured with us. We don't share with anyone.
Create professional graphs and charts in seconds. Upload your data, paste from Excel, or enter manually. Our AI handles the formatting and you get perfect results instantly.
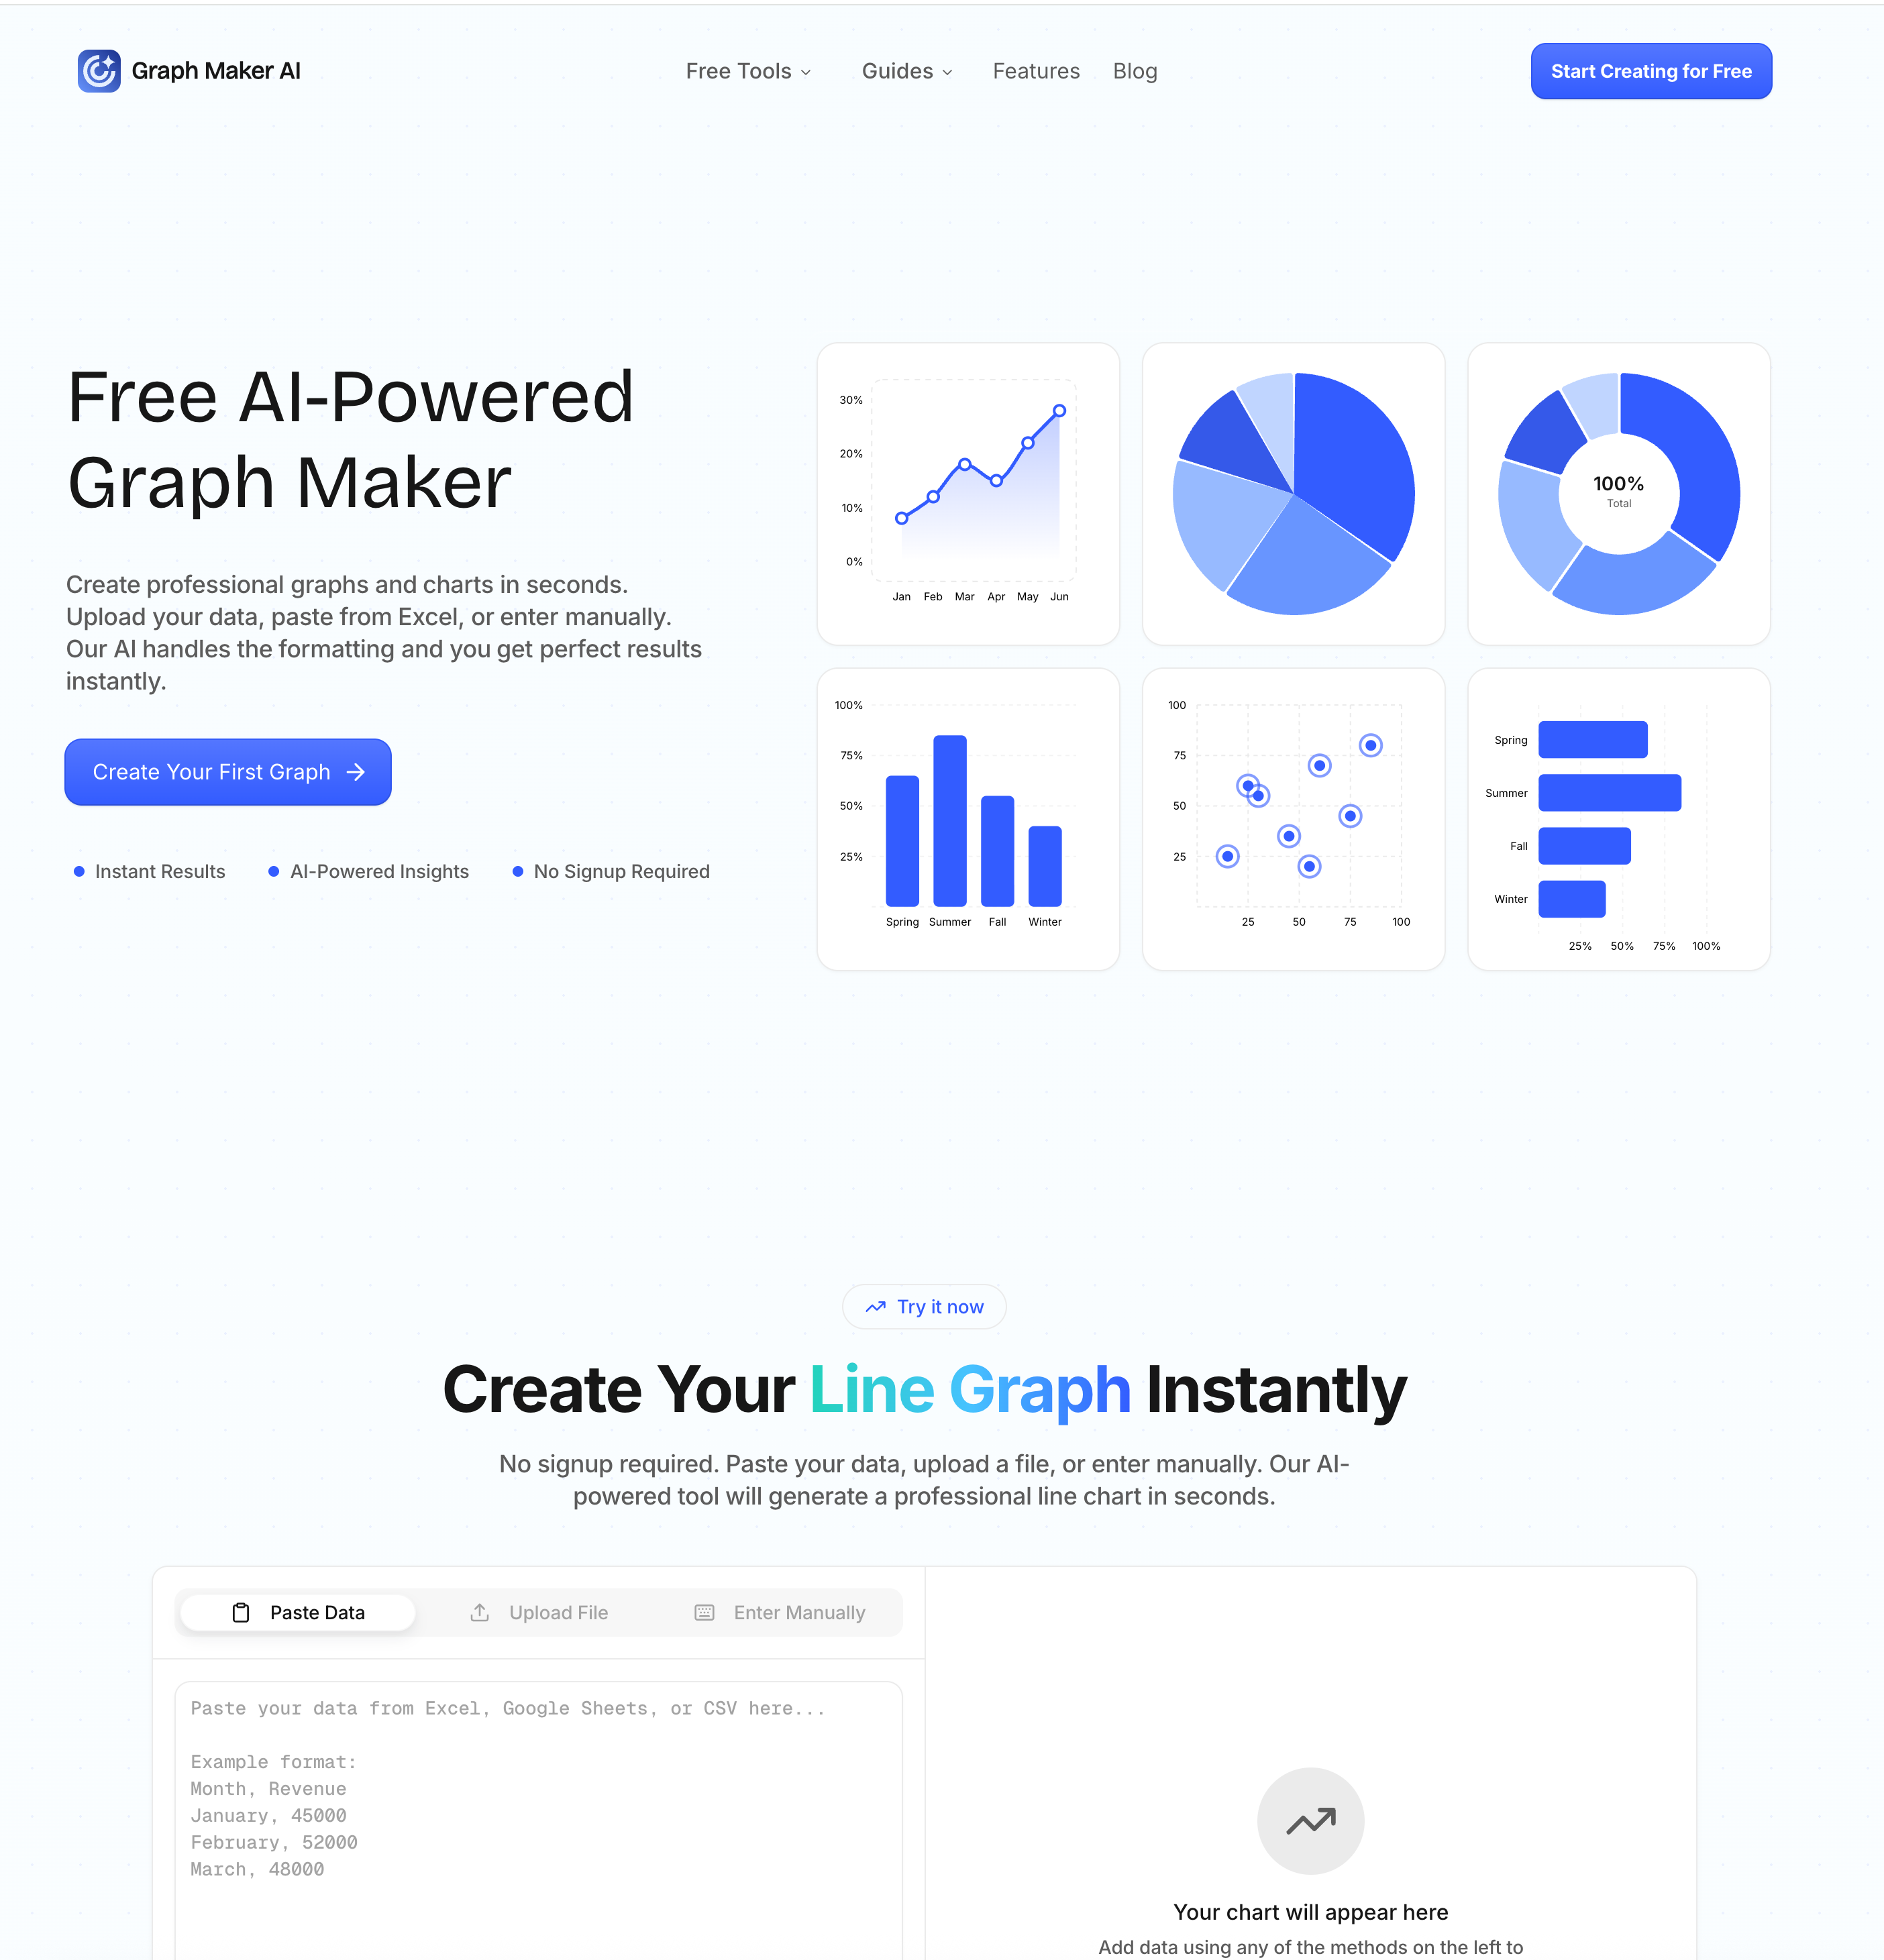
Graph Maker is a modern AI tool that transforms the traditionally complex process of data visualization into a fast, intuitive, and highly efficient Image Generation experience. Designed for users of all skill levels, the platform enables anyone to create professional graphs and charts within seconds by simply pasting or uploading their data. Instead of manually configuring axes, labels, and formatting—as required in traditional tools—Graph Maker uses artificial intelligence to handle all the technical details automatically, allowing users to focus on insights rather than setup.
One of the most impressive aspects of Graph Maker is its seamless approach to Image Generation. As soon as users input their data, the AI analyzes it and instantly generates a suitable graph, whether it’s a line chart for trends, a pie chart for proportions, or a scatter plot for correlations. This intelligent automation not only saves time but also ensures that the chosen visualization type best represents the underlying data. The result is a clean, visually appealing chart that can be used directly in presentations, reports, or digital content.
Beyond speed, Graph Maker also excels in flexibility and customization. While the initial graph is generated automatically, users can fully edit every aspect of the visualization, including themes, labels, legends, and dimensions. This combination of automation and control makes it a powerful AI tool for both beginners who want instant results and professionals who require precise adjustments for their visual outputs. Real-time updates further enhance the experience, allowing users to modify data and instantly see changes reflected in the graph without reprocessing.
Another standout feature is the platform’s ability to generate insights alongside visualizations. Instead of just producing static images, the AI interprets the data and highlights trends, patterns, and relationships. This adds significant value, turning basic Image Generation into a more intelligent and analytical process that helps users better understand their data.
Graph Maker supports a wide range of chart types, including bar graphs, histograms, radar charts, and more, making it suitable for diverse use cases such as education, marketing, business analysis, and research. With export options in high-quality PNG and JPEG formats, users can easily integrate their visuals into reports, dashboards, or social media content.
Overall, Graph Maker stands out as a highly efficient AI tool that redefines Image Generation for data visualization. By combining automation, speed, customization, and intelligent insights, it empowers users to create professional, meaningful graphs with minimal effort, making it an essential solution for modern data-driven workflows.
What is Graph Maker AI?
Create professional graphs and charts in seconds. Upload your data, paste from Excel, or enter manually. Our AI handles the formatting and you get perfect results instantly.
Why Choose Our Graph Maker?
1、10x Faster Graph Creation
Create graphs in 10 seconds instead of 10 minutes. No more wrestling with Excel formulas, axis formatting, or design menus.
2、AI Understands Your Data
Our graph maker AI analyzes your data, suggests the best visualization type, and even provides insights about trends and patterns.
3、Zero Learning Curve
If you can paste data, you can make graphs. No tutorials, no complexity, no frustration. Start creating professional graphs immediately.
Who Uses Our Graph Maker?
From students to CEOs, thousands of people use our free graph maker every day to visualize their data.
Students & Educators
Students use our graph maker for homework, science projects, and presentations. Teachers create graphs for lessons and classroom materials. No software installation needed.
Marketers & Content Creators
Marketing teams use our free graph maker to visualize campaign data, create social media graphics, and build client reports. Turn spreadsheets into shareable visuals instantly.
Business Analysts & Data Professionals
Analysts stop wasting time in Excel and use our graph maker to generate publication-ready visualizations. Export in PNG or JPEG and drop directly into reports and dashboards.
Small Business Owners & Founders
Founders use our graph maker to create investor-ready financial charts, track business metrics, and build pitch decks. Professional graphs without hiring a designer.

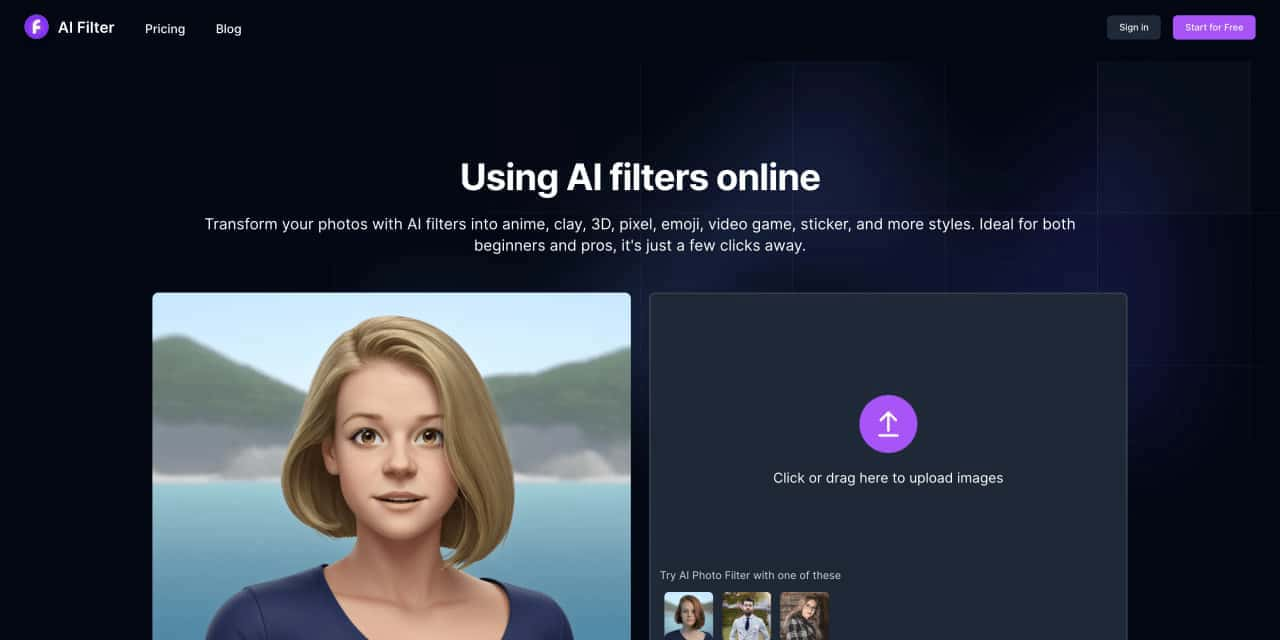
Transform your photos with AI filters into anime, clay, 3D, pixel, emoji, video game, sticker, and more styles
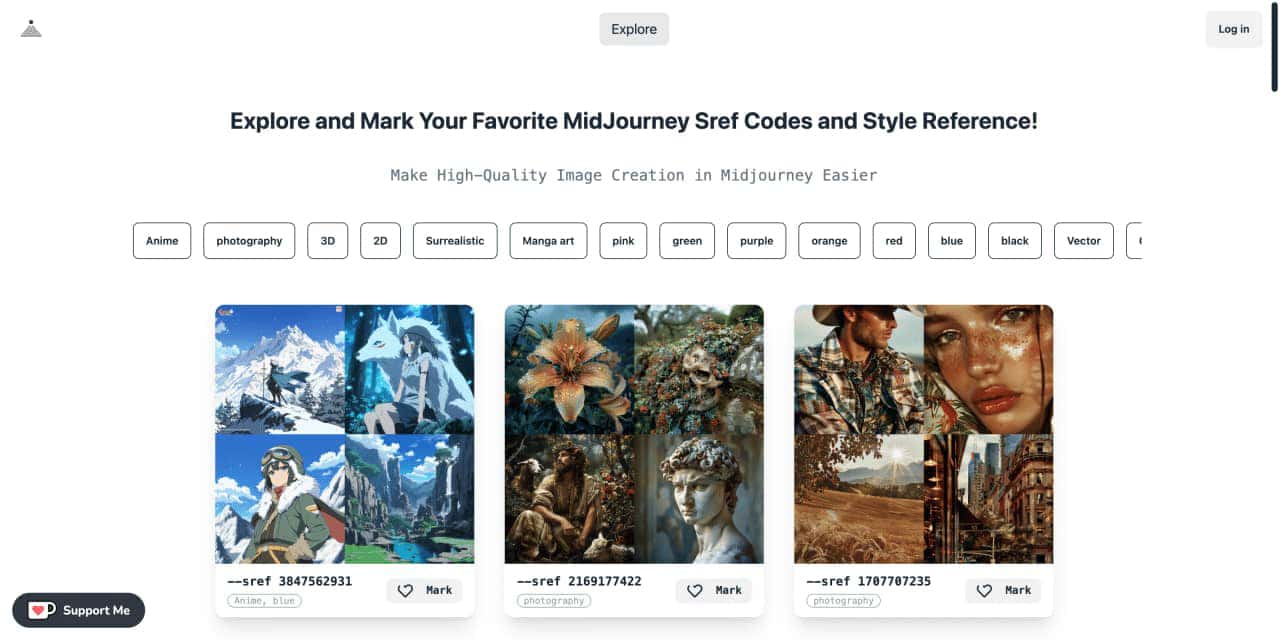
Explore a list of 181 unique midJourney sref code and style references to find your perfect MidJourney sref code effect.
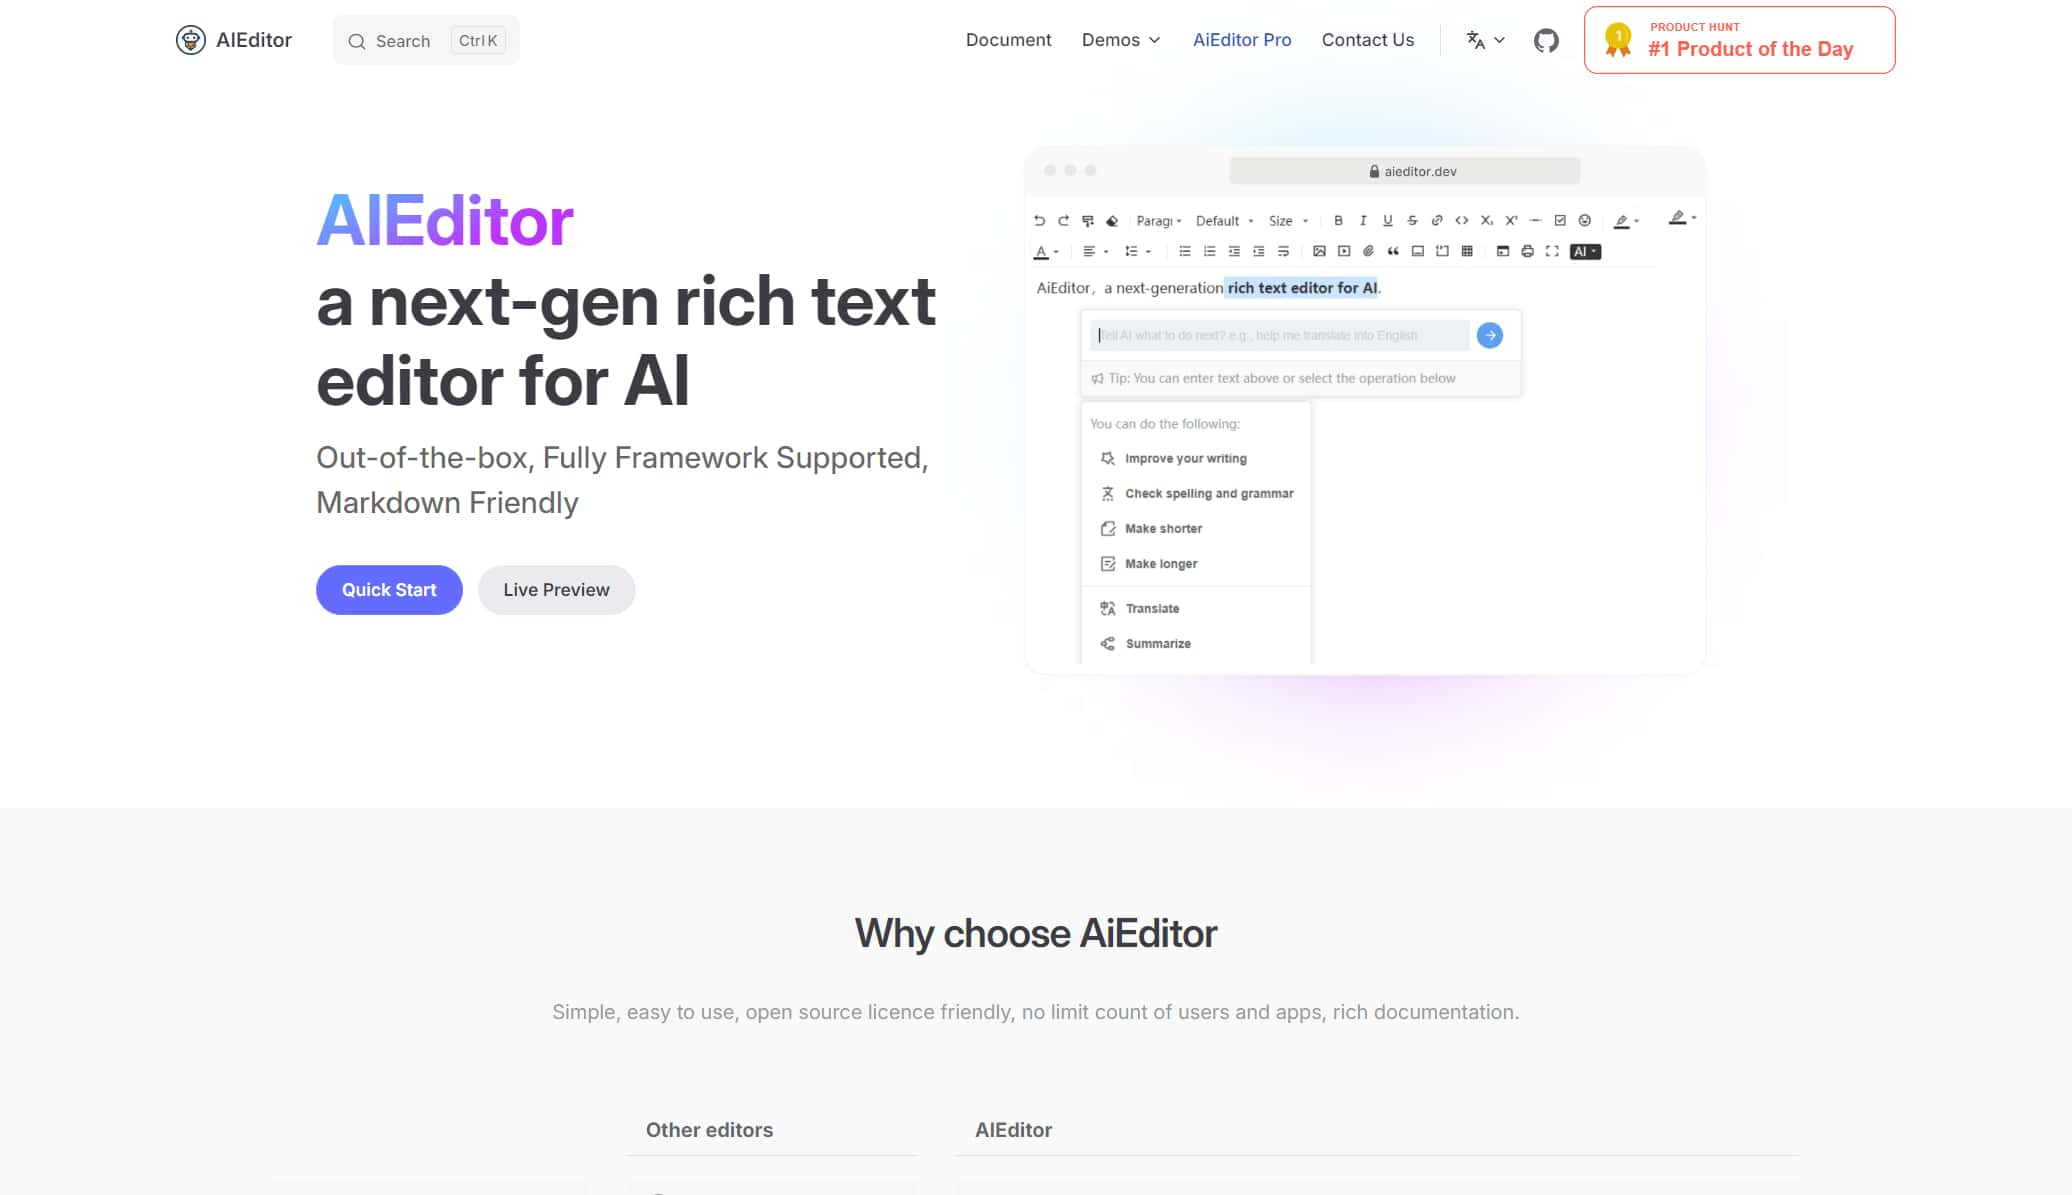
A next-generation rich text editor for AI, open-source rich text editor, modern rich text editor

Your next travel idea, let's talk here. Plan your travel with AI. Discover what to do on your upcoming vacation. Find things to eat in the most popular destinations in the world.


Flux 2 Max represents the most advanced release in the Flux 2 lineup, designed for creators who demand precision, realism, and production-ready visual output. As both a high-end AI Image Generator and a powerful AI Image Editor, Flux 2 Max pushes visual quality and consistency to a new level, making it suitable for professional creative workflows.
In this digital age, AI image generation tools are sparking an unprecedented creative revolution.Today, we delve into the mechanics of AI image generation, explore its underlying technology, and guide you in creating your own AI artwork!
This comprehensive guide explores the best AI image generators available in 2026, highlighting their unique features, strengths, and ideal use cases. We'll dive deep into each tool's capabilities to help you identify which AI image generator best suits your creative needs.