订阅AI通讯
您的数据完全安全。我们不会与任何人共享。
Create professional graphs and charts in seconds. Upload your data, paste from Excel, or enter manually. Our AI handles the formatting and you get perfect results instantly.
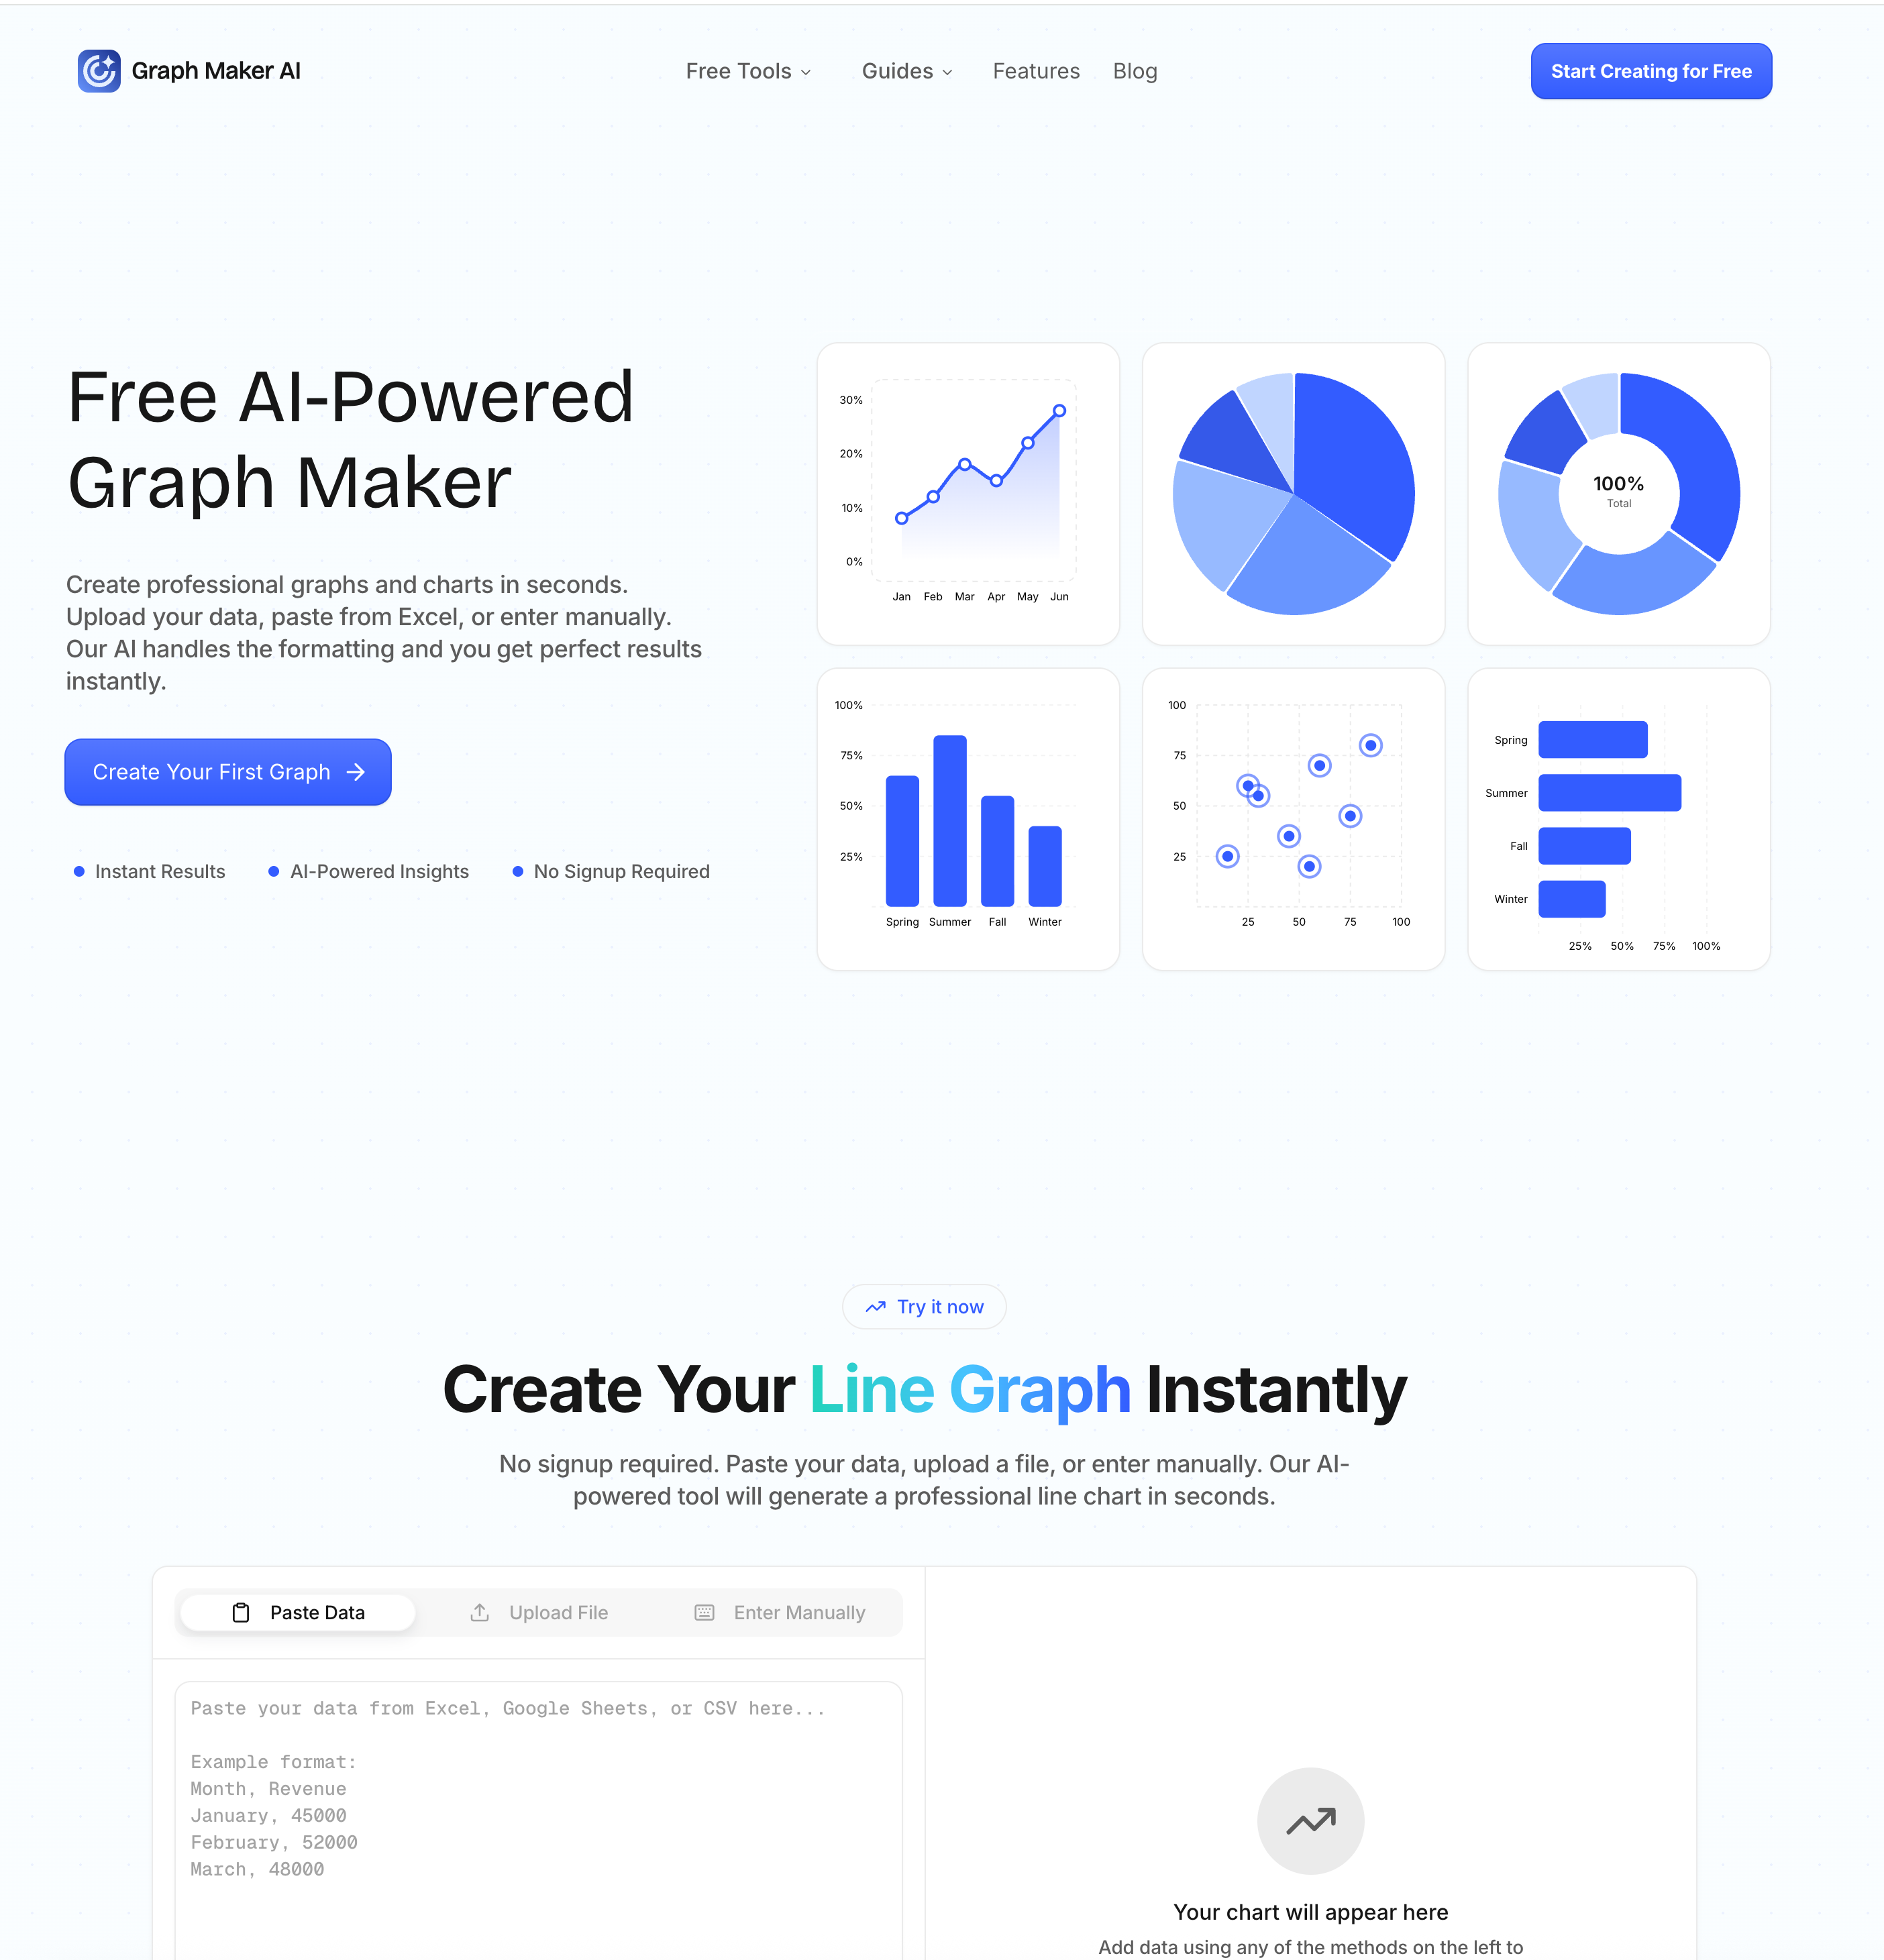
Graph Maker is a modern AI tool that transforms the traditionally complex process of data visualization into a fast, intuitive, and highly efficient Image Generation experience. Designed for users of all skill levels, the platform enables anyone to create professional graphs and charts within seconds by simply pasting or uploading their data. Instead of manually configuring axes, labels, and formatting—as required in traditional tools—Graph Maker uses artificial intelligence to handle all the technical details automatically, allowing users to focus on insights rather than setup.
One of the most impressive aspects of Graph Maker is its seamless approach to Image Generation. As soon as users input their data, the AI analyzes it and instantly generates a suitable graph, whether it’s a line chart for trends, a pie chart for proportions, or a scatter plot for correlations. This intelligent automation not only saves time but also ensures that the chosen visualization type best represents the underlying data. The result is a clean, visually appealing chart that can be used directly in presentations, reports, or digital content.
Beyond speed, Graph Maker also excels in flexibility and customization. While the initial graph is generated automatically, users can fully edit every aspect of the visualization, including themes, labels, legends, and dimensions. This combination of automation and control makes it a powerful AI tool for both beginners who want instant results and professionals who require precise adjustments for their visual outputs. Real-time updates further enhance the experience, allowing users to modify data and instantly see changes reflected in the graph without reprocessing.
Another standout feature is the platform’s ability to generate insights alongside visualizations. Instead of just producing static images, the AI interprets the data and highlights trends, patterns, and relationships. This adds significant value, turning basic Image Generation into a more intelligent and analytical process that helps users better understand their data.
Graph Maker supports a wide range of chart types, including bar graphs, histograms, radar charts, and more, making it suitable for diverse use cases such as education, marketing, business analysis, and research. With export options in high-quality PNG and JPEG formats, users can easily integrate their visuals into reports, dashboards, or social media content.
Overall, Graph Maker stands out as a highly efficient AI tool that redefines Image Generation for data visualization. By combining automation, speed, customization, and intelligent insights, it empowers users to create professional, meaningful graphs with minimal effort, making it an essential solution for modern data-driven workflows.
What is Graph Maker AI?
Create professional graphs and charts in seconds. Upload your data, paste from Excel, or enter manually. Our AI handles the formatting and you get perfect results instantly.
Why Choose Our Graph Maker?
1、10x Faster Graph Creation
Create graphs in 10 seconds instead of 10 minutes. No more wrestling with Excel formulas, axis formatting, or design menus.
2、AI Understands Your Data
Our graph maker AI analyzes your data, suggests the best visualization type, and even provides insights about trends and patterns.
3、Zero Learning Curve
If you can paste data, you can make graphs. No tutorials, no complexity, no frustration. Start creating professional graphs immediately.
Who Uses Our Graph Maker?
From students to CEOs, thousands of people use our free graph maker every day to visualize their data.
Students & Educators
Students use our graph maker for homework, science projects, and presentations. Teachers create graphs for lessons and classroom materials. No software installation needed.
Marketers & Content Creators
Marketing teams use our free graph maker to visualize campaign data, create social media graphics, and build client reports. Turn spreadsheets into shareable visuals instantly.
Business Analysts & Data Professionals
Analysts stop wasting time in Excel and use our graph maker to generate publication-ready visualizations. Export in PNG or JPEG and drop directly into reports and dashboards.
Small Business Owners & Founders
Founders use our graph maker to create investor-ready financial charts, track business metrics, and build pitch decks. Professional graphs without hiring a designer.
分享实用笔记,帮助他人评估此工具。
暂无评论。开始对话吧。


探索精心挑选的 Codex 皮肤,保存收藏,并在 macOS 或 Windows 上自定义 Codex 桌面版,同时保留原生 UI。

NanoBananaAI 是一款由 Nano Banana Pro(谷歌先进图像模型)驱动的免费 AI 图像生成器。通过自然语言提示词,创建、编辑和转换令人惊叹的视觉效果,无需设计技能。

通过想法或脚本生成无脸短视频。在生成前检查吸引点、配音、视觉、字幕和场景规划。
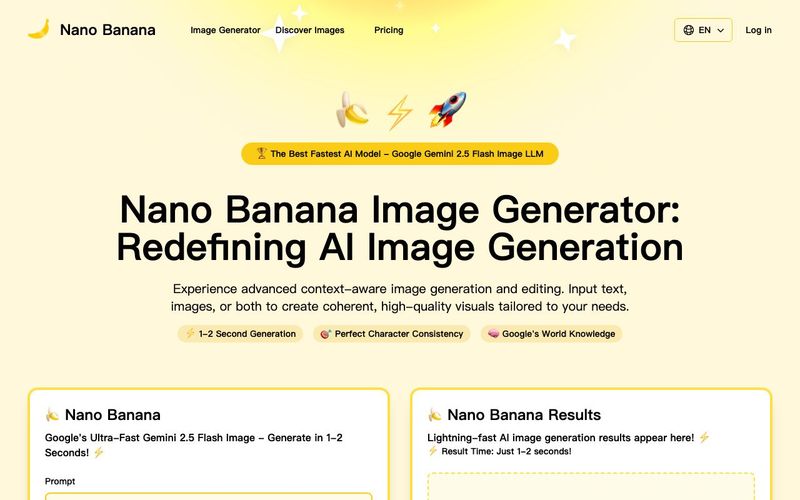
Discover Nano Banana, the next-generation multimodal model for context-aware image generation and editing. Combine text and image prompts to create, edit, and refine visuals with unmatched consistency and style.


Flux 2 Max 是 Flux 2 系列中最先进的版本,专为追求高精度、真实感和生产级视觉输出的创作者而设计。作为一款高端的 AI 图像生成器(AI Image Generator) 与强大的 AI 图像编辑器(AI Image Editor) 的结合体,Flux 2 Max 将图像质量与一致性提升到了全新高度,非常适合专业级创作流程。
随着人工智能的飞速发展,11月成为了全年最具突破性的月份之一。从新一代图像模型和令人惊叹的视频工具,到能够编写代码、构建应用程序、清理杂乱数据,甚至从零开始创建完整学习中心的 AI 助手,应有尽有。无论你是创作者、营销人员、学生、开发者,还是仅仅是一位人工智能爱好者,本月的种种新发现都会让你重新思考人工智能的无限可能。
2025年最佳AI大模型与AI工具,最受欢迎的免费AI大模型与AI工具。

With the launch of the iOS 18.1 Beta version, registered developers can now experience some of the features of Apple AI, a cutting-edge addition to AI tools.